
The new manager stands between two rows of vans, holding a calendar full of service dates and still unable to answer the question: which truck is due next? Beside him, a salt-crusted pickup is wearing enough winter road film to conceal a slow leak. “The calendar's useful,” says the veteran operator, “once the vehicles start telling it the truth.”
Table of Contents
- Fleet Maintenance Schedules at a Glance
- Setting Service Triggers From Real Vehicle Use
- Preventive Maintenance Checklist by Vehicle Area
- Why Preventive Maintenance Beats Breakdown Repairs
- Choosing Between In-House and Outsourced Service
- Controlling Fleet Maintenance Costs Per Kilometre
- Where Washing, Detailing and Rust Proofing Fit
- Build Your Fleet Maintenance Plan This Month
Fleet Maintenance Schedules at a Glance
A schedule only works if each vehicle has a clear due rule. Start with its class, then write down three cadences: the formal service interval, the recurring inspection and the wash or underbody-cleaning interval. Use the manufacturer's manual and your telematics thresholds when they set a different service trigger.
| Vehicle class | Formal service interval | Inspection cadence | Wash and underbody cadence |
|---|---|---|---|
| Light vans and pickups | Every 10,000 km or six months | Weekly walk-around | Every two weeks in winter |
| Ride-hailing passenger cars | Every 10,000 km or six months | Weekly visual check | Every one to two weeks |
| Medium-duty trucks | Every 15,000 km or six months | Daily documented pre-trip | Every two weeks in winter |
| Heavy-duty trucks | Every 25,000 km or 250 engine hours | Daily pre-trip plus weekly documented check | Every two weeks in winter, underbody first |
| Electric vans | Manufacturer's schedule, often 20,000 km or annually | Weekly charging and battery visual check | Monthly wash plus underbody rinse |
The interval is the planned service point, not permission to ignore a warning until that date. A truck with a brake concern needs attention when the concern appears. The recurring inspection catches wear and damage between scheduled services, while washing removes dirt and salt that can hide or accelerate deterioration.
In Ontario, a salted route calls for more frequent underbody attention than a dry, low-use vehicle. Rinsing the underside every two weeks through winter is a practical starting cadence for vehicles regularly exposed to treated roads. It's a cleaning and corrosion-control task, not a substitute for a technician's brake or suspension inspection.
For a fuller scheduling framework, this guide to preventive maintenance scheduling for truck fleets can help managers turn repeat service tasks into a consistent process.
Yard rule: Pick the vehicle's class, use the first trigger that arrives, and copy that row into the shared calendar. Keep the manufacturer's manual and telematics rules in charge when they call for an earlier visit.
Setting Service Triggers From Real Vehicle Use
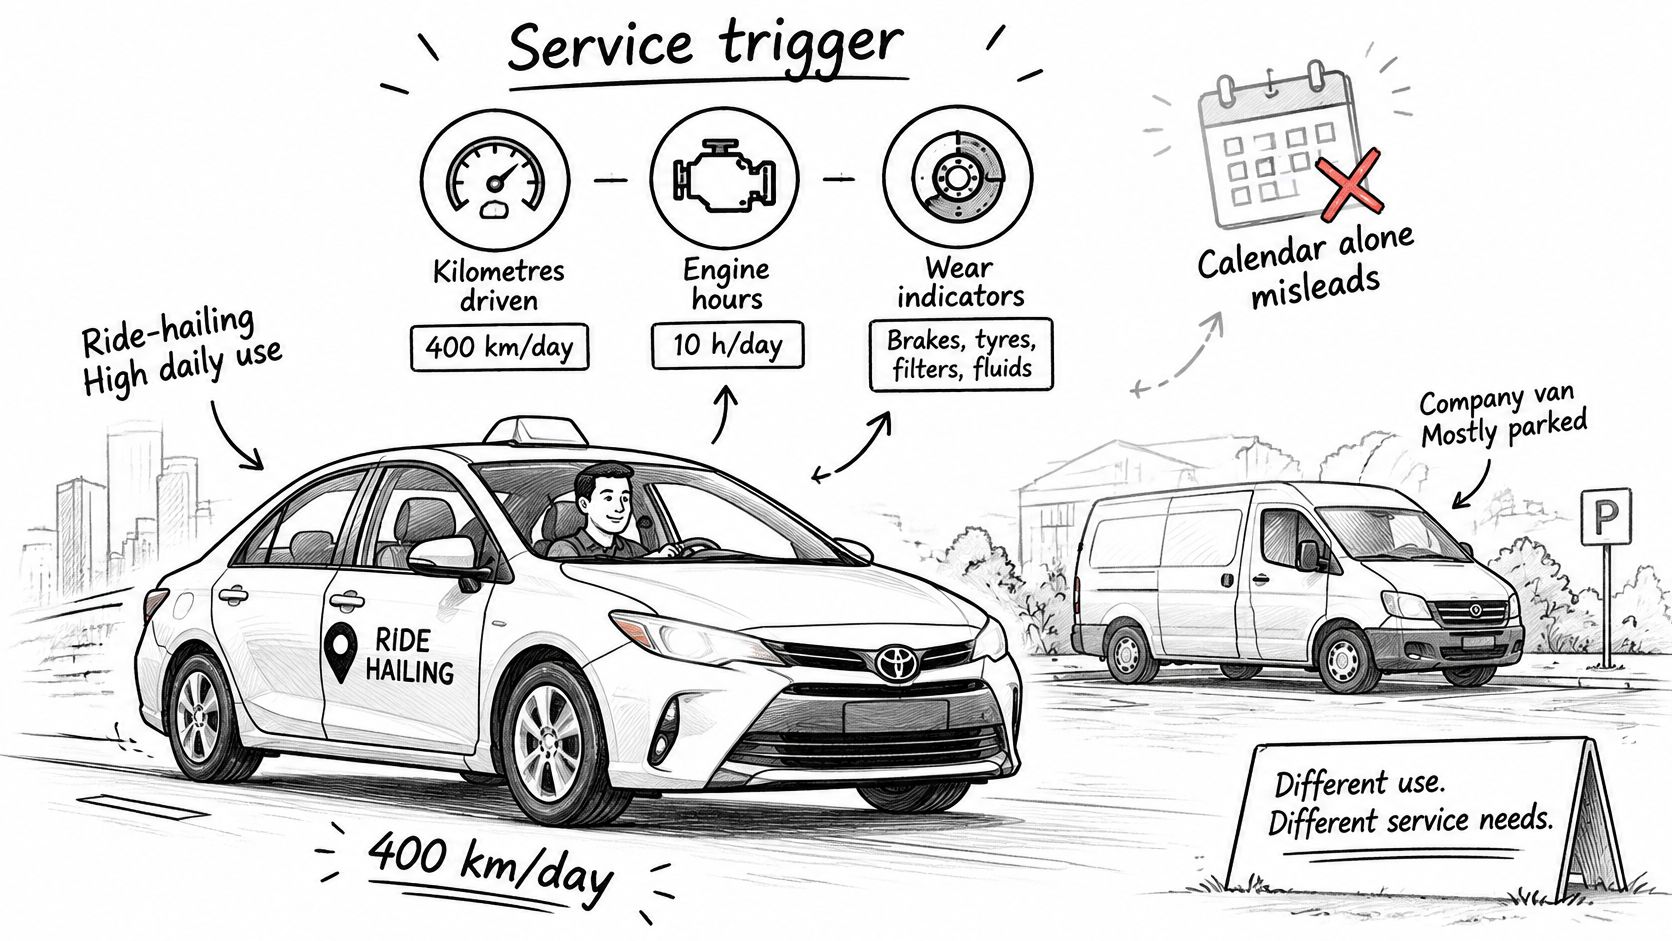
A ride-hailing car logging 400 km a day can reach a service threshold far sooner than a company van that sits in the yard most of the week. If both vehicles get service only because a calendar reminder appears, one may be overdue while the other is being serviced unnecessarily.
Canadian fleet-maintenance guidance recommends using actual vehicle use rather than calendar dates alone. Telematics can combine odometer readings, engine hours, diagnostic fault codes, driver vehicle inspection reports (DVIRs) and repair history to trigger work orders at defined thresholds. For GTA fleets, stop-and-go traffic, idling, short trips, winter operation and changing daily mileage make a calendar-only plan especially unreliable, as described in Samsara's fleet maintenance guidance.
Set three triggers
For each vehicle, record a kilometre threshold, an engine-hour threshold where relevant, and an elapsed-time limit. Service the vehicle when the first threshold arrives. That rule prevents a low-mileage vehicle from being forgotten for too long, while also stopping a hard-working vehicle from waiting for a distant calendar date.
For example, suppose a delivery van has a 10,000 km service trigger and reaches 7,500 km in six weeks. If its mileage continues at that pace, it may hit the distance limit before the six-month time limit. The manager should schedule service at the kilometre threshold, not wait for the calendar reminder. The same logic applies to a vehicle whose engine hours climb quickly while its odometer moves slowly.
Turn warning signs into work orders
Fault codes and DVIR entries should act as escalation signals, not notes to revisit later. A recurring warning, tire defect, brake concern or visible fluid leak needs an inspection task as soon as it's reported. Waiting until the next routine service can turn a small defect into an avoidable stop.
At every visit, record the vehicle identifier, odometer, engine hours, defect source, corrective action and next due threshold. Those consistent records help reveal patterns, such as one vehicle with repeat faults or a route that wears brakes faster than others.
Start with ten vehicles, set all three triggers for each, and review the results after 90 days. Fix confusing intervals and missing records before you roll the system out across the fleet.
Preventive Maintenance Checklist by Vehicle Area
Say a yard manager spots salt crust creeping along a brake line during a walk-around. A quick report and inspection can keep that small finding from becoming a missed shift. The checklist below makes those checks part of the uptime budget: drivers flag symptoms, technicians assess safety-critical parts, and managers confirm each defect reaches closure.
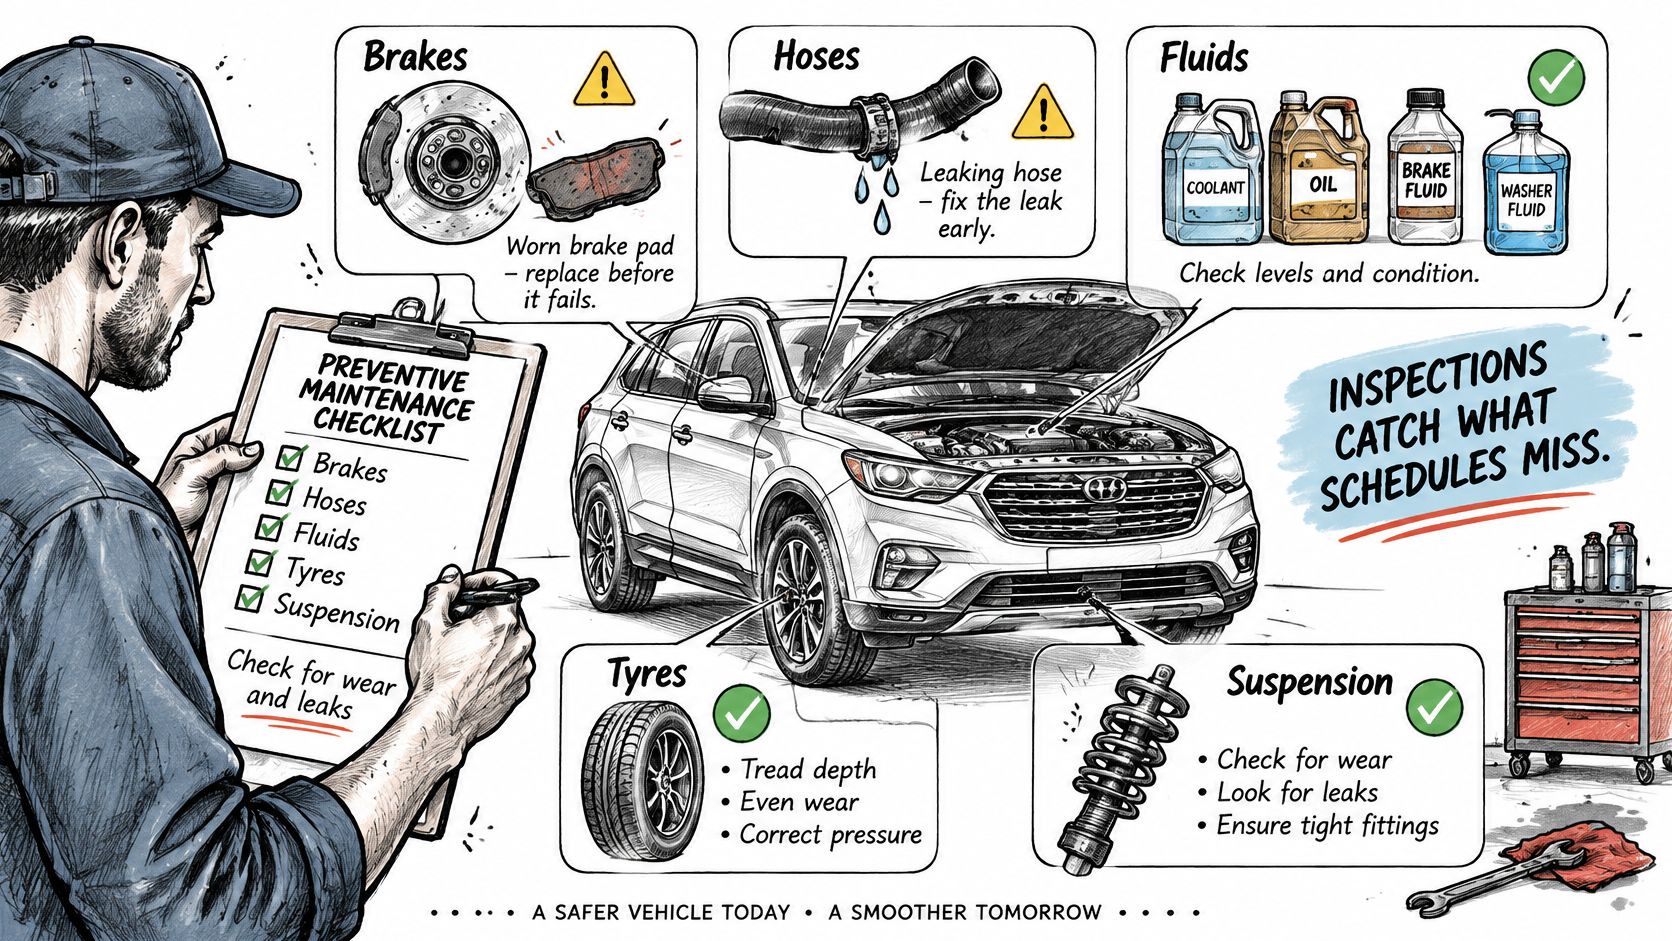
| Area | What to check | Frequency | Who checks |
|---|---|---|---|
| Brakes | Pad wear, pulling, noise, visible leaks | Pre-trip and every service | Driver spots, technician repairs |
| Tires and wheels | Tread depth, cuts, bulges, wheel nut torque | Pre-trip | Driver, technician checks torque |
| Lights and signals | Bulbs, lenses, mounting, aim | Weekly | Driver |
| Fluids and leaks | Oil, coolant, brake fluid, drip marks underneath | Pre-trip | Driver reports, technician fixes |
| Underbody and frame | Salt build-up, corrosion at fasteners and lines | Every two weeks in winter | Wash provider photographs, technician inspects |
| Load securing | Straps, chains, rear door latches | Each load | Driver |
| Steering and suspension | Play, worn bushings, fluid seepage | Every service | Technician |
| Documentation | Defect log, DVIR, service record | Each trip and each service | Fleet manager audits |
For commercial vehicles in Ontario, check tread against the applicable provincial commercial-vehicle standard rather than using a passenger-vehicle minimum. Replace winter tires before wear compromises grip; legal compliance alone does not guarantee useful traction on a salt-slick route.
A useful defect report identifies the vehicle, date, location on the vehicle and what changed. “Truck feels weird” starts a conversation, but “pulls left under braking” gives the technician a symptom to investigate. That detail can help distinguish a developing brake problem from a general complaint before dispatch turns it into downtime.
Make the records useful
During each winter wash, photograph visible underbody salt damage and attach the images to the vehicle's maintenance record. Log defects with the date and vehicle identifier, including minor items that were checked and cleared. Over time, those records make repeat problems easier to spot without relying on drivers and technicians to reconstruct events from memory.
Safety-related repairs belong with qualified professionals. If an incident raises questions about restraint-system work, managers can review about Safety Restore's repair services and direct the vehicle to appropriately qualified repair support.
The daily pre-trip walk-around is a low-cost check with a clear job: catch visible or operational defects before the vehicle leaves the yard. Drivers need a consistent routine, not a mechanic's tool kit. A reported concern can then go to a technician for assessment, while the manager tracks it through to closure.
Why Preventive Maintenance Beats Breakdown Repairs
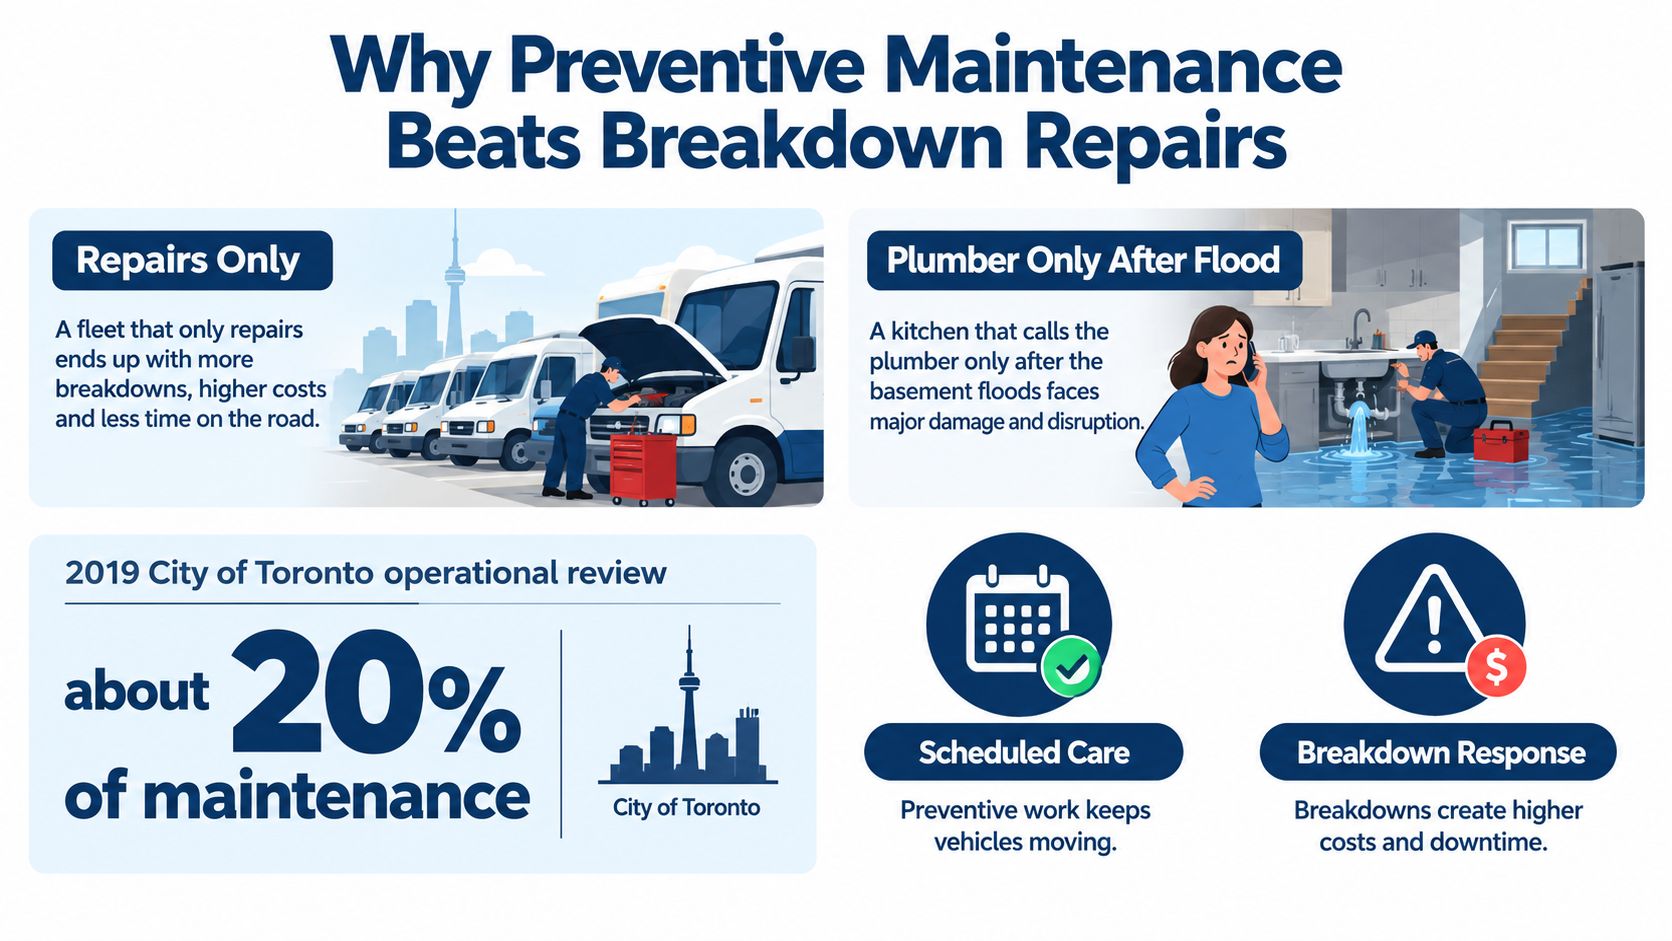
A fleet that only fixes vehicles after failure is like a kitchen that calls a plumber after the basement floods. Toronto's 2019 operational review found that about 20% of maintenance work was preventive, against an internal target of 60%, while 80% was corrective repair, according to the City of Toronto's review.
The bigger warning came from availability: one in seven vehicles or pieces of equipment, representing approximately $68 million in assets, was out of service daily. That's not just an invoice problem. A vehicle that can't work still represents capital that the operator can't put to work.
Repeat repairs also eat into uptime. In the review, 24% of Class 8 heavy-duty vehicles experienced a repeat repair within 60 days. During January and February 2019, approximately one-fifth of medium-duty vehicles and one-third of heavy-duty vehicles were out of service daily. The figures show why a fleet manager should watch downtime and repeat work, not only the cost of the most recent repair.
A repair you prevent is cheaper than a repair you schedule, and far cheaper than one you tow.
Put cleaning in the preventive mix
Routine cleaning helps make inspections practical. Road film and packed dirt can hide a leak, body damage, tire problems or early corrosion; removing that layer gives drivers and technicians a better chance to see what needs attention. Underbody rinsing and corrosion control address road salt, while a visual check during cleaning can identify a concern worth sending to a technician.
Cleaning doesn't diagnose a brake fault or make a vehicle safe to dispatch. It's one part of a broader plan that combines inspections, timely mechanical repairs and a record of what the team found. The useful question isn't whether a truck looks tidy, but whether its condition can be checked and its defects acted on before the next route.
To measure the gap between planned care and breakdown response, track preventive share, repeat repairs, daily out-of-service vehicles and the value of assets unavailable for work. The next step is to turn those measures into a monthly cost view.
Choosing Between In-House and Outsourced Service
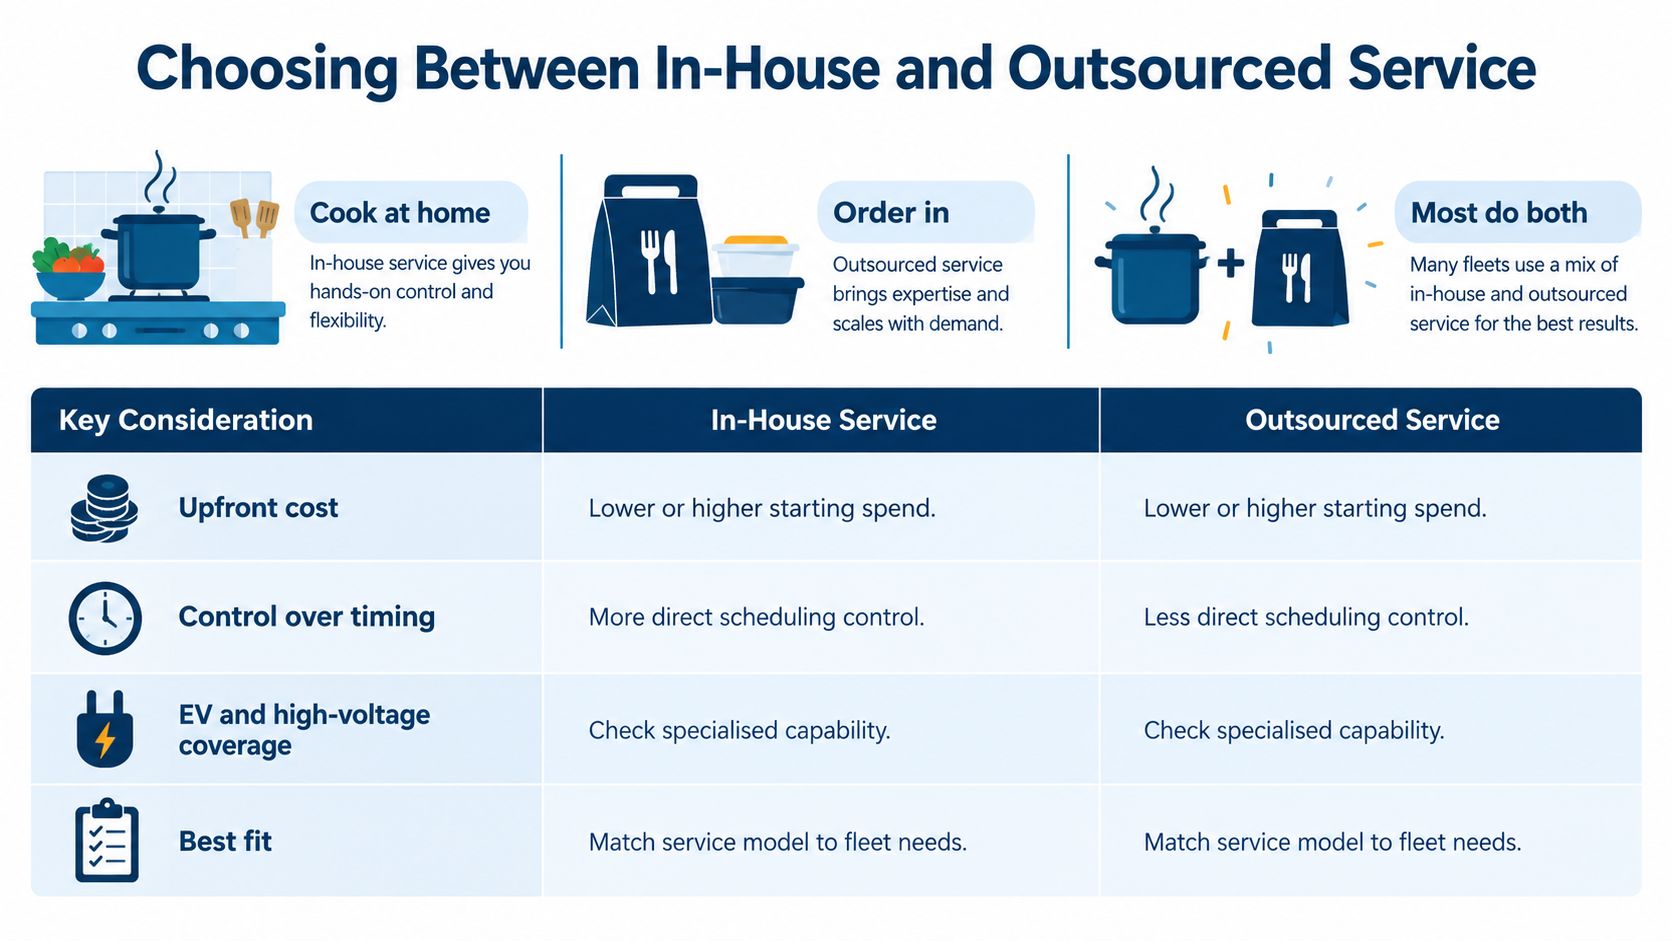
Some fleets cook at home, some order in, and most do both. A shop with its own bay can control routine work, but it must fund equipment and technician time. An outside provider avoids that setup, but service timing depends on the agreement and available capacity.
| Criterion | In-house shop | Outsourced provider | Hybrid model |
|---|---|---|---|
| Upfront cost | High: bays, tools, technicians | Low: pay per job | Medium |
| Control of timing | High | Moderate, defined by contract | High for routine work, lower for major repairs |
| EV and high-voltage coverage | Hard to staff and maintain | Certified providers available | Core work in-house, EV work outsourced |
| Best fleet size | Above 40 with steady routes | 1 to 15 vehicles | 15 to 40 vehicles |
| Downtime risk | Lower with a spare bay | Tied to provider queue | Moderate, reduced by a service agreement |
| Cost per kilometre at scale | Lower | Higher at volume | Balanced |
An electric fleet adds a capability question that a low routine-maintenance estimate doesn't answer. Canada's 2025 zero-emission medium- and heavy-duty vehicle ecosystem analysis identifies skills gaps involving fire safety, battery diagnostics, charging technologies, diagnostic software and high-voltage safety protocols, as detailed in the Canadian analysis.
A manager evaluating an EV should separate scheduled maintenance savings from unplanned downtime. Ask what happens if a charger fails, a battery diagnostic is needed or a qualified technician isn't available. Route fit and winter operation matter, too. National averages can't tell you whether a particular vehicle will make your specific routes and return to a working charger on time.
Choose a model that protects uptime
For a small fleet, outsourcing is often the sensible starting point: the operator pays for service without maintaining a dedicated shop. A fleet with a steady workload can bring routine checks and common fast fixes in-house, provided it has the people, tools and space to do them properly.
A practical size-based starting point is outsourcing for fleets under 15 vehicles, a hybrid model for fleets of 15 to 40, and in-house routine work for larger fleets with steady routes and a spare bay. These are planning guidelines, not a substitute for checking each operation's service volume and technical needs.
The hybrid model is straightforward: keep routine preventive work and fast fixes close to the fleet, then send high-voltage or major component work to qualified providers under a written service agreement. A small shop shouldn't promise EV work it can't staff safely. For a mixed fleet, the arrangement can also preserve conventional corrosion-control work for gasoline and diesel vehicles while qualified technicians handle EV safety-critical tasks.
Before choosing a provider, ask three questions: How quickly can you respond? What certifications cover the work? What happens to the vehicle while it waits? Get the answers in writing, especially if a vehicle being out of service leaves a route uncovered.
Controlling Fleet Maintenance Costs Per Kilometre
A manager sees a $6,000 repair bill and thinks the fleet must be in trouble. Then the cost-per-kilometre calculation shows the vehicles are working hard, preventive service is on track and that van isn't the outlier. The invoice looks dramatic; the operating rate tells the more useful story.
Total spending can mislead because a larger fleet naturally has more vehicles to maintain. Divide maintenance spend by kilometres driven to compare vehicles and groups on a common basis. Toronto's 2021 budget documentation reported light-duty fleet-maintenance costs of approximately $0.21 to $0.30 per kilometre across the reported years. It also showed preventive maintenance at 57% to 70% of maintenance activity, with the most recent figure at 70%, in the City of Toronto budget report.
Say a fleet spends $2,400 on maintenance in a month and drives 9,000 km. Divide the spend by the distance: the cost is $0.27 per kilometre, inside the reported light-duty benchmark. That doesn't prove every repair was necessary, but it gives the manager a fair starting point for comparing months and vehicle classes.
| Metric | How to calculate | Reference value |
|---|---|---|
| Maintenance cost per kilometre | Total maintenance spend divided by kilometres driven | Roughly $0.21 to $0.30 for light-duty GTA fleets |
| Preventive share | Preventive work hours or spend divided by total maintenance | Toronto reported 57% to 70%; 2019 internal target was 60% |
| Repeat repair rate | Repeat jobs within 60 days divided by total repairs | Track the trend; the Class 8 example was 24% |
| Out-of-service share | Vehicles out of service on a typical day divided by fleet size | Toronto's 2019 review found one in seven |
Read the warning signs together
Cost per kilometre explains what each kilometre costs to maintain; preventive share shows whether the shop is planning or mostly reacting. Repeat repair rate exposes jobs that haven't stayed fixed, while out-of-service share shows how many assets are unavailable for work. A single metric can look healthy while another signals trouble.
A rising repeat-repair rate matters more than one unusually high bill. One expensive repair may reflect a specific failure; recurring work on the same vehicle or component points to a fault that needs investigation. Check whether the repair recurred on the same vehicle, whether similar vehicles show the same issue, and whether the route or duty cycle is a factor.
Review the figures monthly and group them by vehicle class. A combined fleet total can hide a van that costs far more to run than its peers, or a heavy-duty group whose route demands more frequent service. Compare like with like, then investigate the vehicle or route that breaks the pattern.
Where Washing, Detailing and Rust Proofing Fit
Say a delivery van returns from a GTA winter route with salt crusted beneath its doors. A rinse clears grime from the underbody, making fresh fluid marks, damaged lines or corrosion easier to spot. Washing does not fix a defect, but it can help a driver or technician see one before it costs a workday.
Recent Ontario Operation Deterrence findings show that a notable share of inspected commercial vehicles had violations or were placed out of service. Treat those inspection results as a prompt to keep defect records current, not as a forecast for every van or pickup. Check visible items such as brakes, tires, lights and load security, and assign mechanical concerns to a qualified technician. Keep the paperwork in order, too. The Ontario trucking enforcement report describes the enforcement findings.
Match each service to the job
Underbody rinsing removes road salt and grime from exposed fasteners and lines, where corrosion can start. Exterior washing clears road film that may hide visible damage. Interior cleaning keeps the driver's workspace and cargo area ready for the next shift. Detailing can remove embedded salt and stains that a basic clean leaves behind.
Rust proofing applies a protective compound to exposed metal. Plan it before winter exposure begins; it helps limit corrosion but does not repair existing structural or mechanical damage. Nanak Car Wash's rust proofing team is made up of certified professionals who use a unique chemical compound to protect vehicles.
Build washing into the uptime budget: rinse the underbody every two weeks in winter, then arrange rust proofing before the first snowfall. Cleaning can reveal a concern, but a technician should assess and sign off on mechanical faults before the vehicle returns to service. A clean truck is easier to inspect, not automatically safe.
Build Your Fleet Maintenance Plan This Month
A manager starts with one clipboard because the spreadsheet is out of date and the next service date is already a mystery. By the end of the month, each vehicle has a class, a clear due rule and somewhere to record defects. The clipboard didn't fix the fleet; a repeatable routine did.
- Group vehicles by class and copy the matching service interval into the shared calendar. This is the cheapest and most valuable step: until vehicles are grouped properly, every later comparison risks mixing unlike work.
- Set three service triggers for each vehicle: kilometres, engine hours where relevant, and elapsed time. Use whichever one arrives first.
- Print the checklist and begin daily pre-trip logging for trucks. Give each driver a simple way to record the vehicle ID, date and defect.
- Pull three months of maintenance spend and mileage. Calculate cost per kilometre and preventive share, then look for repeat jobs.
- Book winter underbody rinses and arrange rust proofing before the first snowfall. Nanak Car Wash offers special prices to fleet and car-related businesses, and its rust proofing team is made up of certified professionals who use a unique chemical compound to protect vehicles.
- Review the metrics after 90 days. Adjust intervals where route conditions, repeat defects or missed work orders show the schedule isn't matching actual use.
A plan doesn't need a large software rollout to become useful. It needs clear ownership, usable records and a routine the drivers and manager can keep following when the yard gets busy.
Request a fleet quote for your next winter rinse and rust proofing, and bring your defect log so the team can work around your schedule. Visit Nanak Car Wash to plan a cleaning and corrosion-control routine that supports your fleet maintenance programme.




 6600 Finch Ave W, Etobicoke, ON M9V 3Z6

 647-703-8515
 MON – SUN 8 AM to 7 PM